
High prevalence of fatty liver and its association with metabolic syndrome among rural adults with chronic hepatitis C: Implications for primary healthcare | BMC Public Health

Design, sample, and setting
A cross-sectional study design with community-based health development was applied to this hepatitis C-endemic area. This was a series of cohort studies related to eliminating the CHC burden around the western coastal Yunlin County, Taiwan, between August 2018 and July 2021 [22]. During specific community liver health screening, rural adults who were anti-HCV-positive were invited to the collaborating hospital for further HCV RNA confirmation [23]. The participants were then referred to the collaborating hospital to receive antiviral therapy by the research team. The inclusion criteria were as follows: (1) fully independent in daily activity and able to walk to the local hospital, (2) age > 20 years and able to communicate in Mandarin or Taiwanese, and (3) agreed to participate in this study and signed the informed consent form. The exclusion criterion was as follows: (1) Currently had alcohol consumption. (2) Since hepatitis B infection may have an inverse effect on hepatic steatosis [24], patients co-infected with hepatitis B were excluded from the study. The participant selection flow chart was described in Fig. 1.
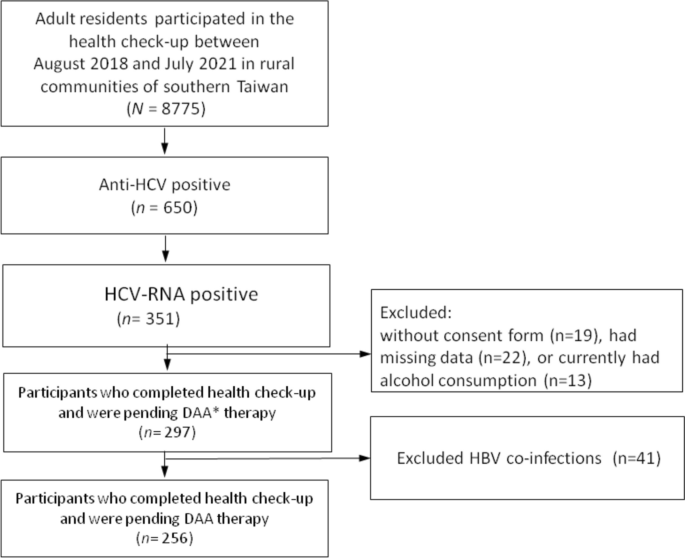
Flow chart of participants’ recruitment, inclusion and exclusion. Abbreviations: DAA Direct-acting antivirals
Procedure and ethical considerations
Before conducting this study, the institutional review board (IRB) (IRB No. 201701919B0) was approved by the ethics committee of the Chang Gung Memorial Hospital. The research team described the study procedures, for example, withdrawal of blood samples after 8 h of overnight fasting to examine blood glucose and lipid levels in all the participants before they came to the collaborating local hospital. Face-to-face interviews were conducted at outpatient clinics, and informed consent was obtained from all literate participants, and from legally acceptable representatives for a small portion of participants who were illiterate. The research assistant measured the participants’ body weight, body height, waist circumference (WC), and blood pressureon the same day. Physiological biomarkers were recorded in the medical charts of the collaborating hospital.
1. Demographic measurements
Demographic characteristics included sex, age, education level (years of education), body weight, body height, and body mass index (BMI, body weight in kilogram/body height in m2). The participants were asked whether they smoked cigarettes, chewed betel nuts, and consumed alcohol (never, quitted, and currently drinking. Currently drinking was defined as 20 g alcohol daily, which is approximately equivalent to 400 mL of 5% beer).
2. Metabolic syndrome and liver biomarkers
MetS was defined by the Taiwan national standard [2], which included the presence of three or more of the following cardiometabolic risk factors: (a) central obesity: WC ≥ 90 and 80 cm in men and women, respectively (WC was measured between the last rib margin and iliac crest (the mid-abdominal distance); (b) systolic blood pressure (SBP)/ diastolic blood pressure (DBP)> 130 and 85 mmHg, respectively; (c) serum high-density lipoprotein cholesterol (HDL-C) levels< 40 and 50 mg/dL in men and women, respectively; (d) serum FBG level >100 mg/dL; and (e) serum triglyceride (TG) level > 150 mg/dL. Any participant currently using medications for hypertension, diabetes mellitus, or hyperlipidemia was classified as having elevated cardiometabolic risk. In addition, three liver biomarkers, serum glutamic-oxaloacetic transaminase (GOT), glutamic-pyruvic transaminase (GPT), and gamma-glutamyl transferase (GGT), were collected in this study.
3. Ultrasonographic screening of fatty liver disease
Ultrasound examinations in the supine position were performed using three units with curved array transducers. Ultrasonography assessment was performed by a team comprised of 3 gastrointestinal physicians and 2 radiologists, all with 6 to 10 years of working experience in abdominal ultrasonography. The diagnosis of fatty liver was established based on the brightness of the liver compared to the kidney, vascular blurring of the hepatic vein trunk, and deep attenuation in the right hepatic lobe [25]. The severity of fatty liver change was divided into four grades (0–3): Grade 0, normal liver, normal echo texture, and no fatty change; Grade 1, mild fatty liver and mild increase in fine echoes in the parenchyma with slightly impaired visualization of the intrahepatic vessels and diaphragm; Grade 2, medium-grade diffuse increase in hepatic echogenicity and mild deterioration in the image of the diaphragm and intrahepatic vessels; Grade 3, moderate to severe fatty liver and marked increase in fine echoes in the parenchyma with poor or no visualization of the intrahepatic vessel borders, diaphragm, and posterior right lobe of the liver.
Data analysis
Based on the grades of abdominal sonography, the participants were classified into two groups: no/mild (grades 0–1) and moderate to severe (grades 2–3) fatty liver. The demographics and characteristics of the participants between groups were compared using an independent sample t-test for continuous variables, the Mann–Whitney U-test for apparently skewed data (e.g., liver biomarkers), and the chi-squared test for categorical variables. The association between moderate to severe fatty liver and cardiometabolic risk factors (e.g., WC) was assessed using linear regression analysis. The association between moderate to severe fatty liver and liver biomarkers was evaluated using quantile regression, in which the 50th percentile (median) was set as the dependent variable. Finally, the association between moderate to severe fatty liver and the risk of abnormality for cardiometabolic risks (e.g., central obesity) and MetS was investigated using logistic regression analysis. Several covariates, including age, sex, and educational level, were adjusted for in the regression models. All tests were two-tailed, and p < 0.05 was considered statistically significant. Data analyses were performed using the Statistical Package for the Social Sciences version 26 (IBM SPSS Inc., Chicago, Illinois, USA).
link


 Is It Worth It?")


